01 — Attacking Analysis
Expected Goals (xG) per Player
Expected Goals (xG) is the probability that a shot goes in, based on where it was taken, the angle to goal, and whether it was a header or a one-on-one. It tells you whether a player scored as many as they "deserved" — or more or fewer.
xG Diff = Goals − xG: a positive number means the player finished better than expected (clinical), negative means they wasted good chances. Hover over any bar or dot for details.
Top 15 players by xG — blue bars are expected goals, green bars are actual goals scored
Each dot is a player. Dots above the dashed line scored more than expected. Bubble size = number of shots taken.
Key Insight
Mbappé scored nearly 4 more goals than his chances were statistically worth — over 32 shots, that is a genuine signal of finishing quality, not luck. Lautaro Martínez created the third-highest xG in the tournament but converted just once, making him the biggest underperformer. Messi's +1.40 over 34 attempts reflects consistent, precise finishing throughout the competition.
02 — Defensive Intensity
Pressing Volume — How Hard Did Teams Chase the Ball?
Pressing means actively running toward the player with the ball to try to win it back, rather than retreating into a defensive shape and waiting. "Pressures per 90" counts how many times a team did this during a typical 90-minute match. A higher number means a more aggressive, high-energy style of defending. The second chart shows where on the pitch teams applied that pressure.
All 32 teams — hover for total pressures and matches played
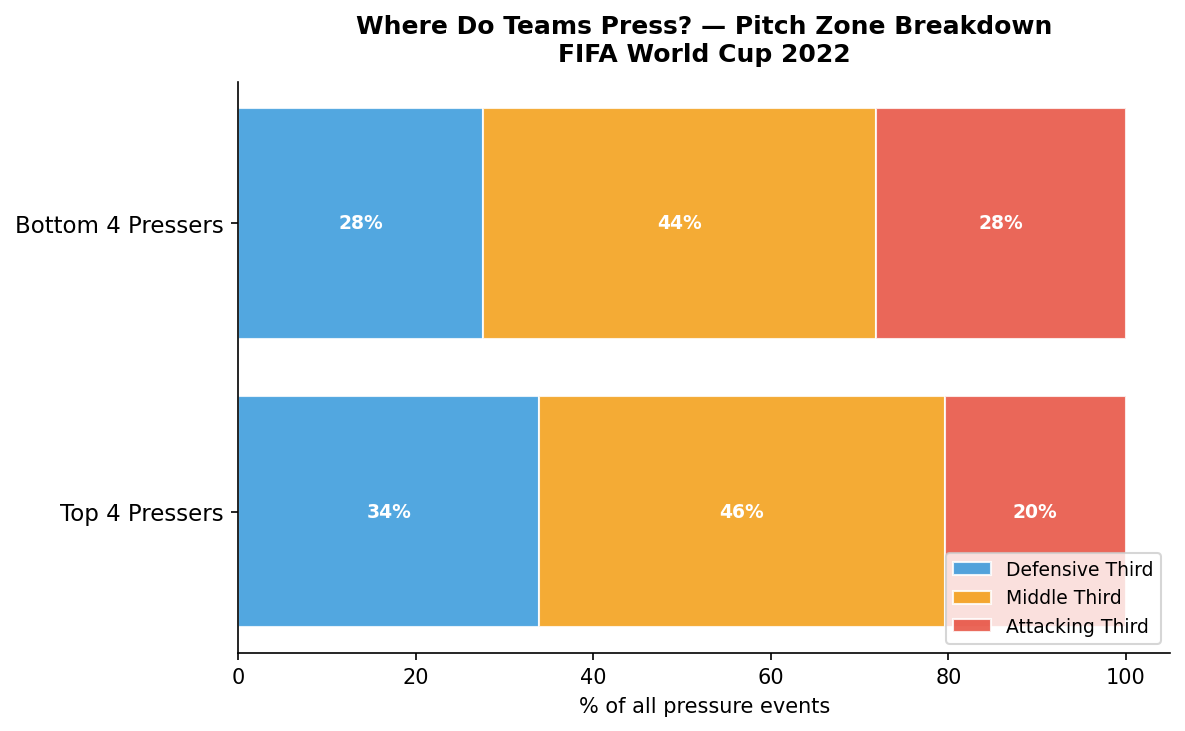
Pitch zone breakdown — top 4 vs bottom 4 pressing teams (click to enlarge)
Key Insight
Japan and Morocco — two of the tournament's biggest overachievers — were also the highest-volume pressers. But the zone chart reveals something counterintuitive: the heaviest pressers actually did more of their pressing in their own half, not the opponent's. This suggests their pressing was often reactive (chasing the ball after losing it) rather than a proactive, high-up-the-pitch strategy. England, who pressed the least, reached the quarter-finals.
03 — Spatial Analysis
Pitch Maps — Where Did it All Happen?
These maps overlay real event data directly onto a football pitch. On Messi's shot map, each circle is a shot he took — bigger bubbles mean higher-quality chances, and red stars mark goals. The heatmaps show where each team applied their pressing — brighter areas indicate higher concentrations of pressing activity. Click any map to enlarge.
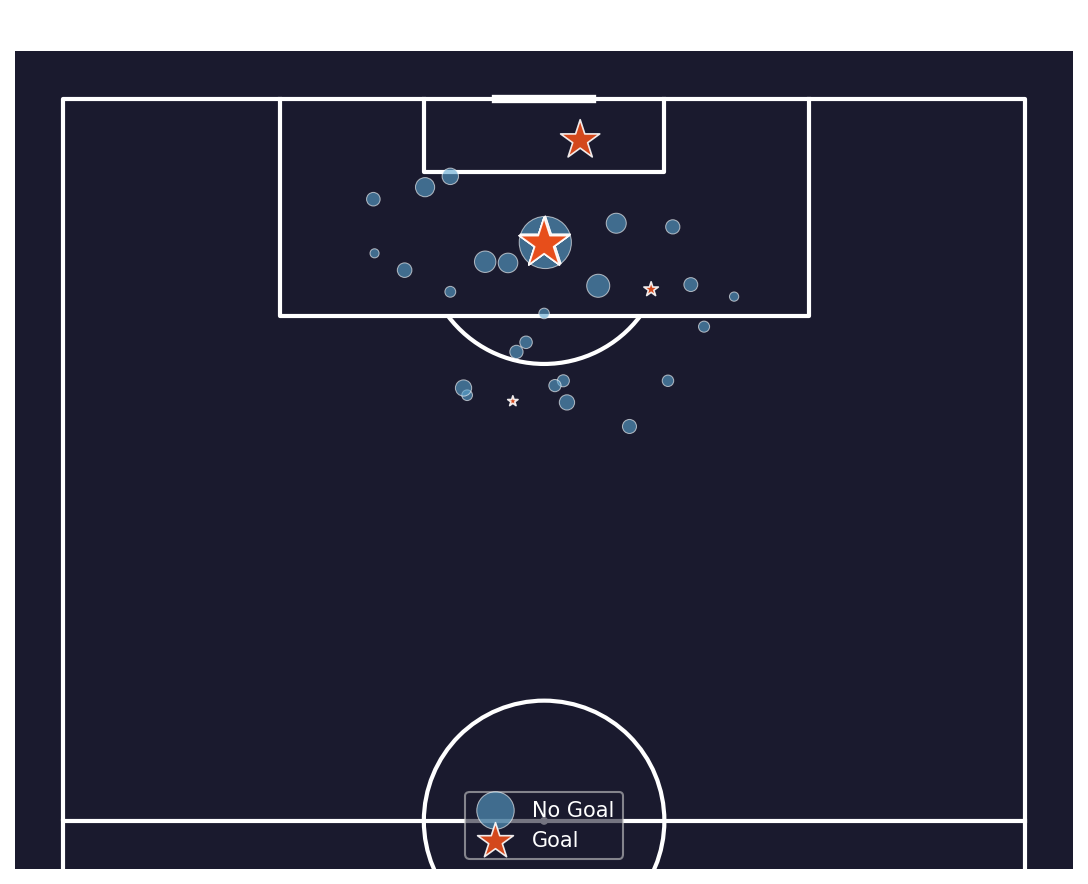
Messi — 34 shots, 9 goals · bubble size = shot quality (xG) · red star = goal
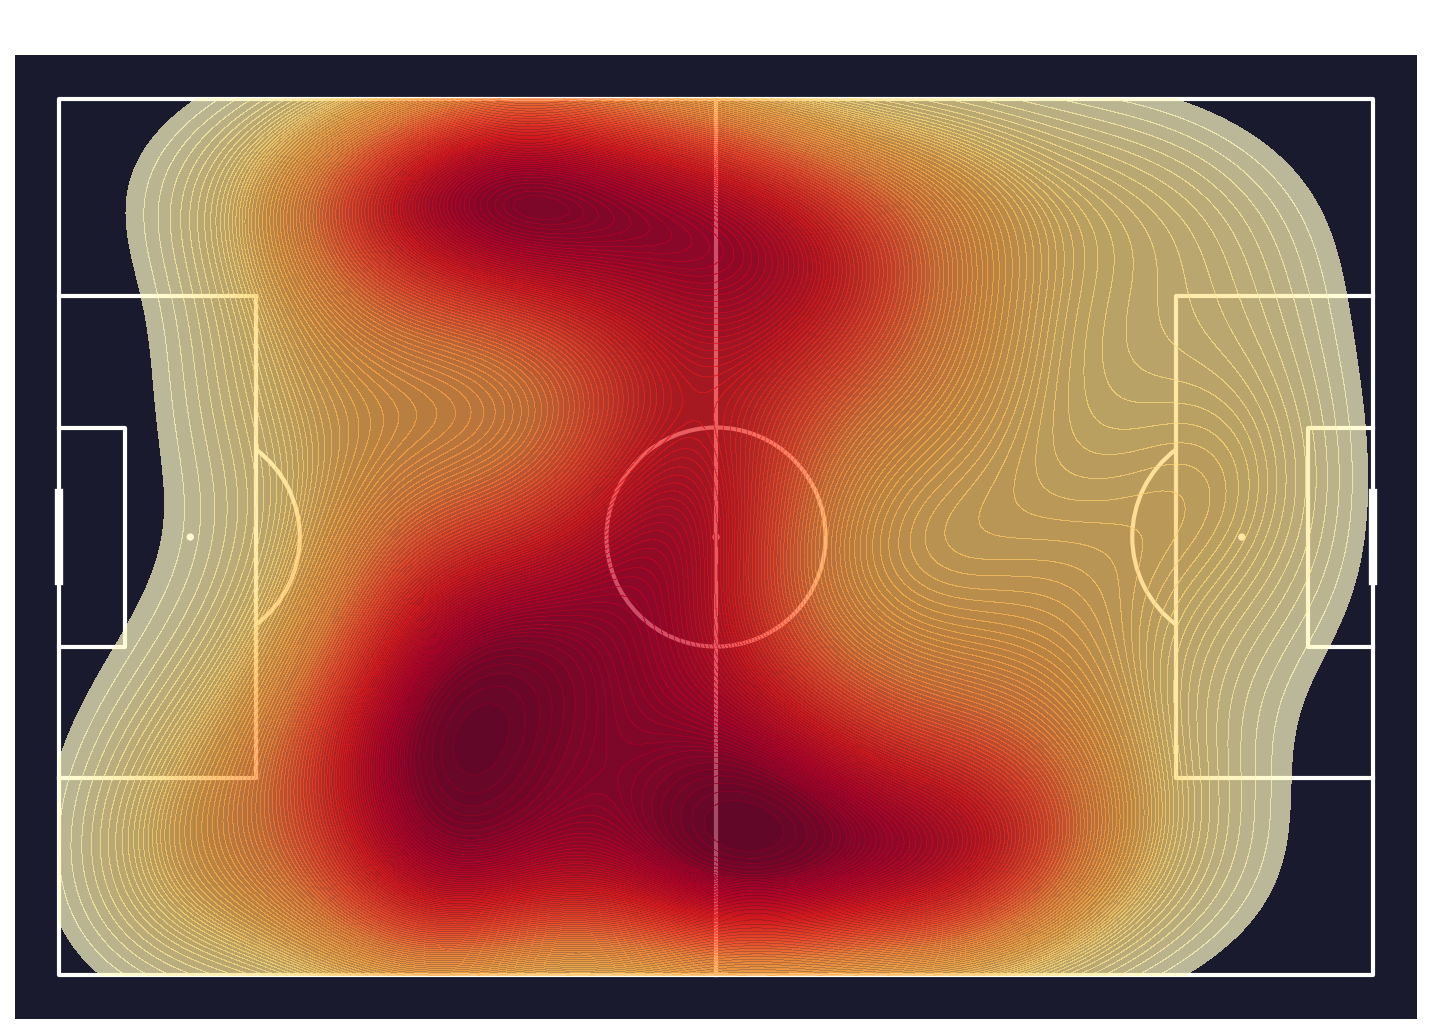
Japan — highest pressing volume (173 per 90 min)
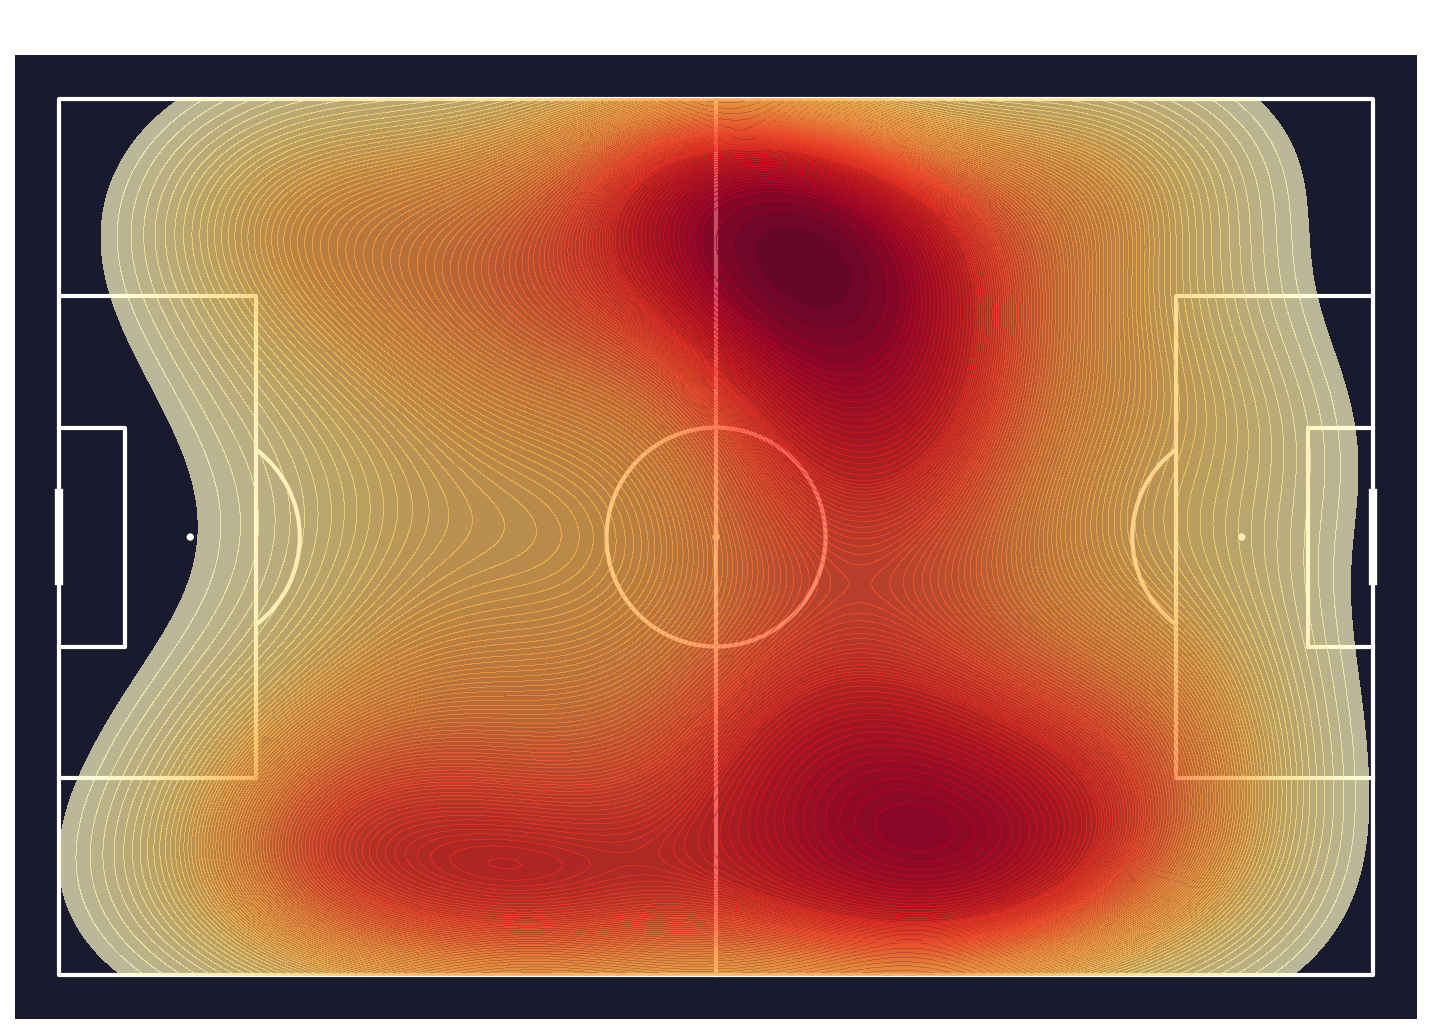
England — lowest pressing volume (97 per 90 min)
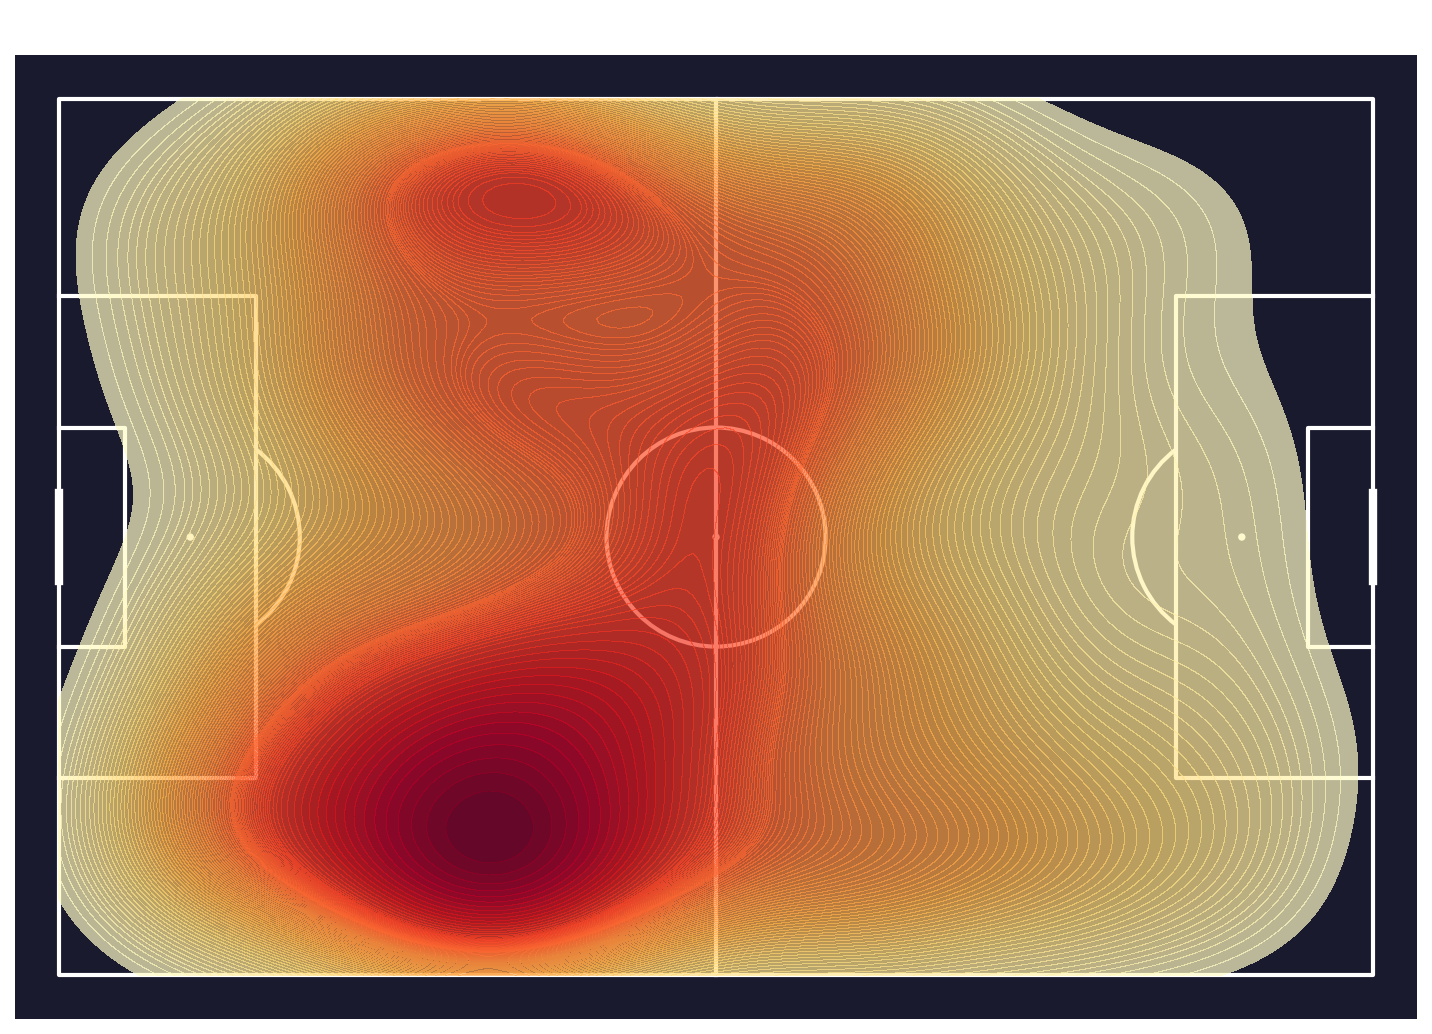
Morocco — 2nd highest pressing volume (155 per 90 min)
Key Insight
The contrast between Japan and England's heatmaps is stark. Japan's pressure is spread across the whole pitch and even into the opponent's half, while England's is heavily concentrated in and around their own box — nearly the opposite philosophy. Messi's shot map shows how effectively he found space inside the penalty area: the majority of his highest-quality chances came from central positions at close range.
04 — Press Effectiveness
Did All That Pressing Actually Work?
Pressing a lot is one thing — winning the ball back is another. A press is counted as "successful" if the pressing team regains possession on the very next action after the challenge. This moves beyond effort and into effectiveness. Each dot below is a team: hover to see their name, pressing volume, and success rate.
Each dot is a team — x-axis is how much they pressed, y-axis is how often those presses paid off
Key Insight
There is a clear negative relationship: the more a team pressed, the lower their success rate tended to be (correlation = −0.465). Spain pressed less than half as often as Japan per 90 minutes, yet won the ball back at three times the rate per press. Pressing smart — choosing the right moment and position — beat pressing hard. Japan's high-volume, low-return approach suggests unfocused or poorly-timed pressing.
05 — Pressing Efficiency
PPDA — How Quickly Did Teams React to the Ball?
PPDA (Passes Allowed Per Defensive Action) asks one question: how many passes does the opponent string together before your team makes a defensive move? A lower PPDA means your team reacts faster — more aggressive, high-intensity pressing. Spain's 2.29 means opponents barely managed 2 passes before Spain stepped in. Poland's 4.63 means they sat back and allowed the ball to circulate more freely before engaging.
Lower PPDA = more aggressive pressing style — hover for defensive action breakdown
Key Insight
The two finalists — Spain and Argentina — had the first and second lowest PPDAs in the tournament. This is not a coincidence: a low PPDA means opponents rarely got comfortable on the ball, which forces mistakes and creates turnovers in dangerous areas. The strong correlation between PPDA and press success rate (r = −0.630) confirms that disciplined, aggressive pressing genuinely translates into winning the ball back more often.
06 — Tactical Adaptation
How Teams Changed Their Pressing by the Scoreline
Teams don't press the same way for the full 90 minutes — they adapt to the scoreline. When winning, do they press more to suffocate the opponent, or do they drop off and protect the lead? When losing, do they throw more players forward and press higher up the pitch? The bars show pressing volume under each game state. The second chart shows which part of the pitch that pressing happened in.
Top 16 teams by pressing volume — pressures per 1,000 events when winning, drawing, and losing
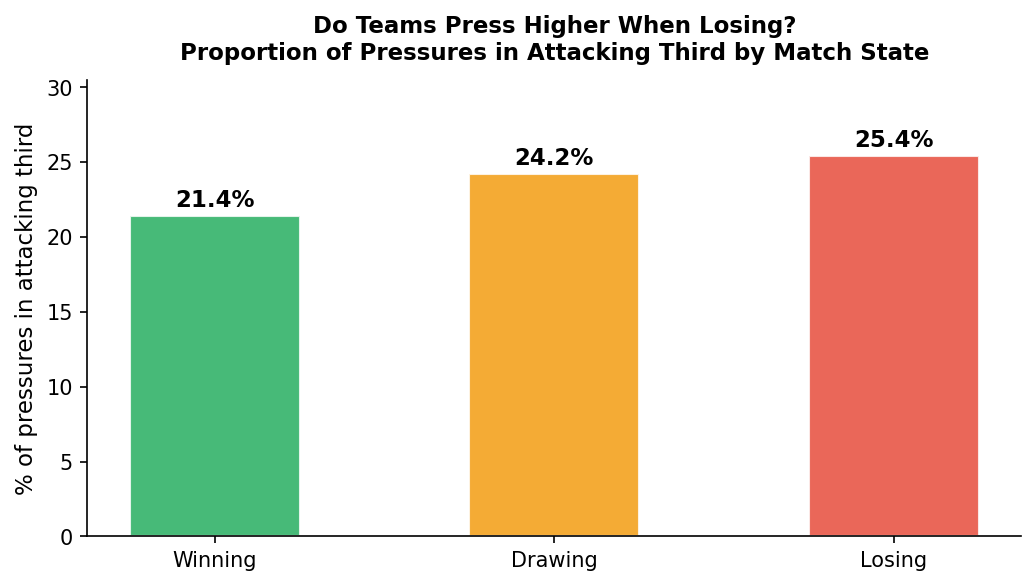
Proportion of pressing in the attacking third — shifts noticeably when teams are losing (click to enlarge)
Key Insight
Across all teams, pressing volume was actually highest when winning — teams use pressing to keep control of the game, not just as a desperation tactic. But when losing, something different happens: pressing shifts higher up the pitch without necessarily increasing in frequency. Teams try to win the ball closer to the opponent's goal to create quick chances. South Korea showed the most extreme version of this, pressing 14.5× harder when losing than when winning — essentially going all-out once behind.
07 — Pressing & Defensive Results
Does Aggressive Pressing Lead to Better Defence?
Here we connect pressing behaviour to actual defensive outcomes. If a team presses aggressively, do they face fewer shots? And are those shots lower quality? We measure "shot quality allowed" as the average xG per shot conceded — the higher this number, the better the chances the opponent created when they did get through. Hover over any dot for the full team breakdown.
Attacking-third press % vs average quality of shots conceded — bubble size = shots faced
PPDA vs average shot quality conceded (r = −0.429, p = 0.014) — bubble size = shots faced
Key Insight
This is the central finding of the entire analysis. Aggressive pressers (low PPDA) concede fewer shots — Spain faced just 27 all tournament, the fewest of any team. But the shots that do get through are higher quality: Spain's average was 0.22 xG per shot conceded, the highest in the tournament. Aggressive pressing creates a real tradeoff: you reduce the volume of chances against you, but the ones that break through tend to be dangerous. Whether that tradeoff is worth it depends on how good your goalkeeper is.
08 — Summary
Key Findings
Headline results across all eight analyses — what the numbers actually say.
FindingValueWhat it means
Top xG overperformer
Mbappé +3.98
Scored 4 more goals than his chances were worth — genuine finishing quality
Top xG underperformer
Lautaro −1.91
Created excellent chances but converted just one all tournament
Highest pressing volume
Japan 173 P/90
Most active pressers — but lowest success rate at only 5.8%
Most effective pressers
Spain 18.0%
Won the ball back on 1 in 5 presses — highest success rate
Most aggressive PPDA
Spain 2.29
Opponents averaged barely 2 passes before Spain made a defensive move
Press volume vs success rate
r = −0.465
Pressing more did not mean winning the ball back more often
PPDA vs success rate
r = −0.630
Efficient pressers (low PPDA) won the ball back far more consistently
Pressing when losing
+4pp in att. third
Teams pressed higher up the pitch when behind — not just harder
Pressing vs shot quality conceded
r = −0.429 ★
Aggressive pressing → fewer shots faced, but higher-quality ones when they got through (p = 0.014, statistically significant)